 Shows Recovery Signs as Technical Indicators Point to Possible Upward Movement")
TLDR
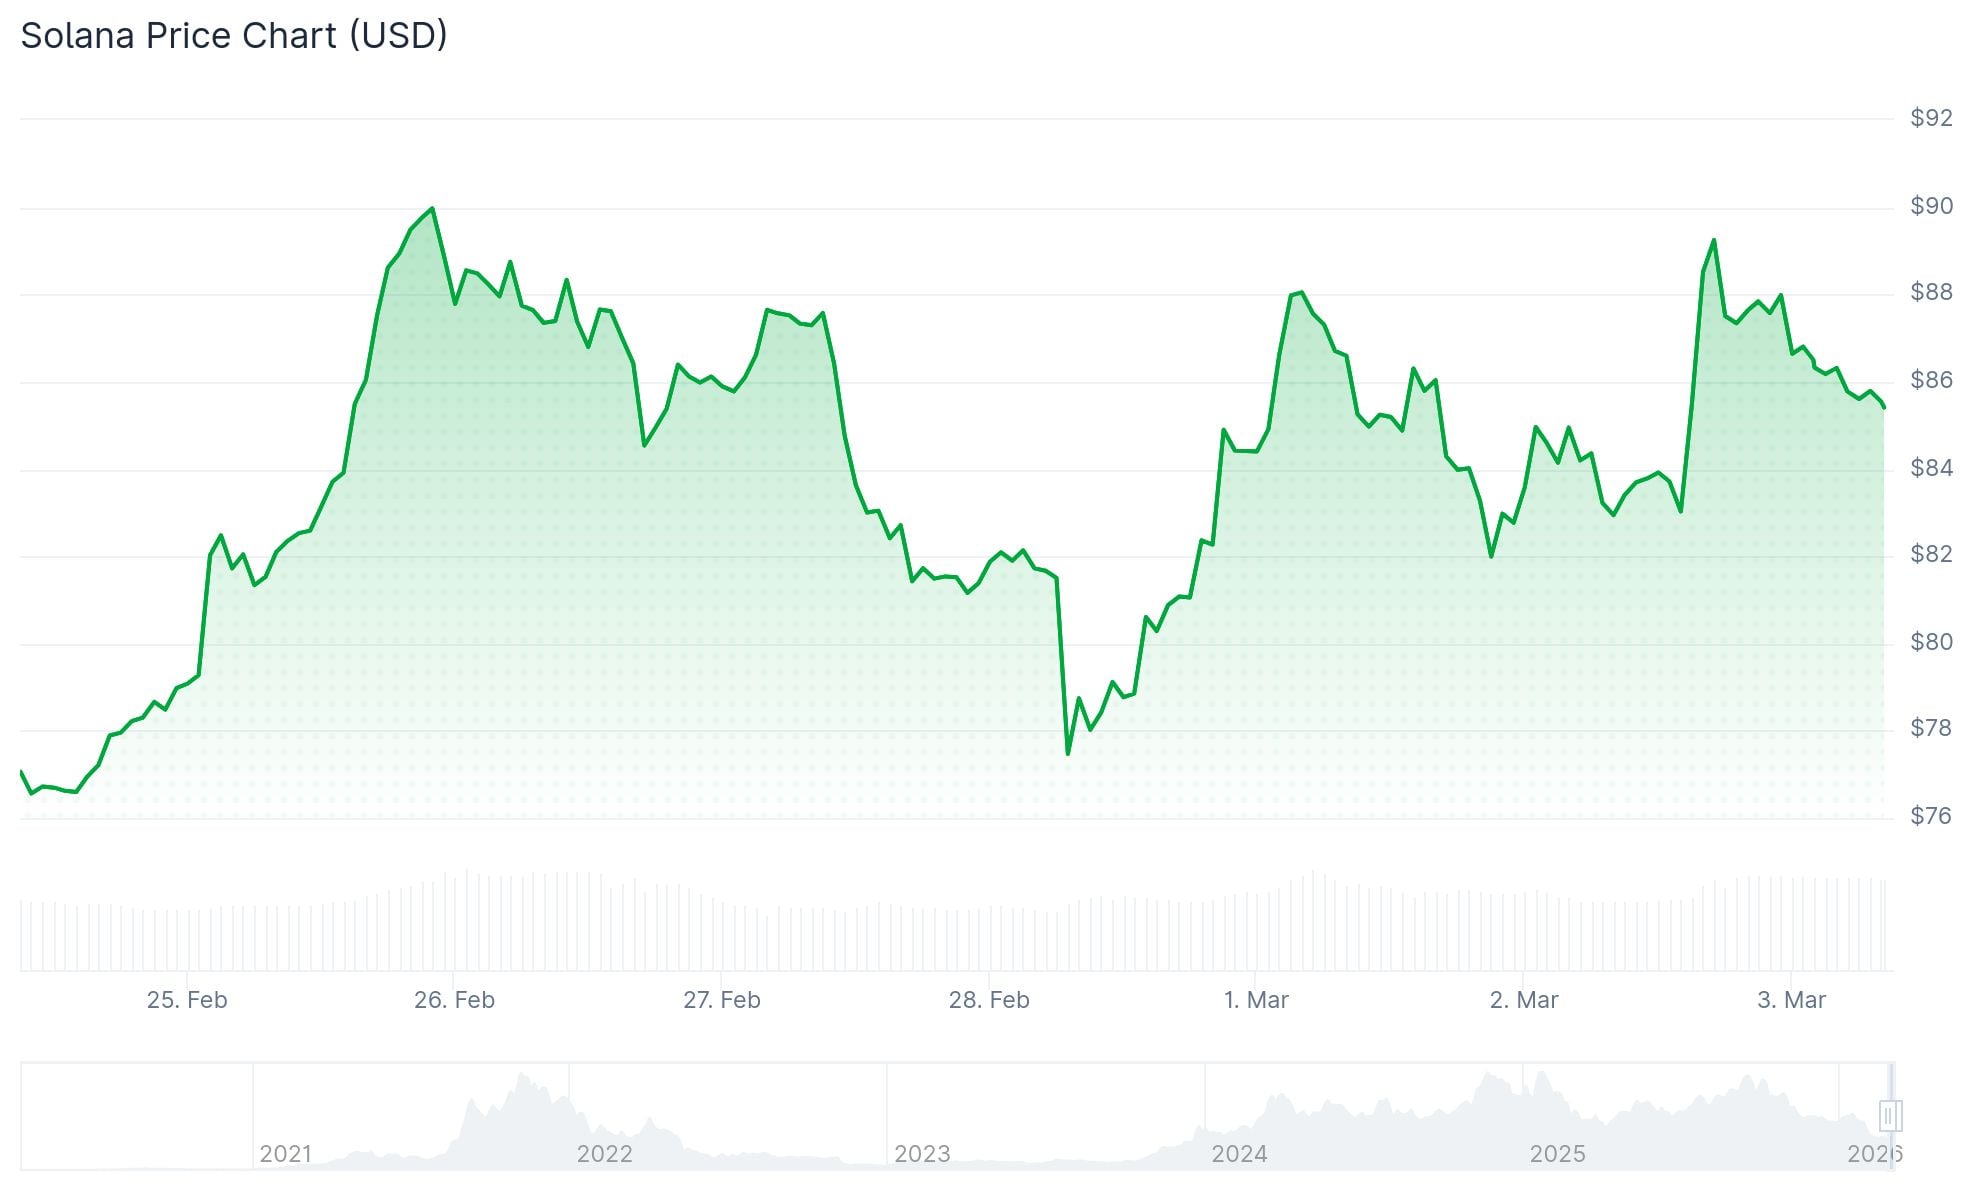
- SOL maintains support around $85 following a retreat from $90 levels
- RSI remains at 47.68 — showing neutral momentum conditions
- SOL moved back above the Ichimoku cloud on the 4-hour timeframe, marking its first reclaim since January
- Traders focus on $88.60 as the critical breakout zone; surpassing this level may trigger movement toward $95–$100
- The 50MA moved above the 100MA, indicating a shift in short-term momentum dynamics
Solana (SOL) currently trades within the $87–$88 range following a retreat from the recent peak of $90.29. The asset experienced downward pressure below both $88 and $87 thresholds before establishing stability above the $85 support zone.
SOL maintains its position above the 100-hourly simple moving average. Trading volume over the past 24 hours reached $9.99 billion, while market capitalization stands at $49.91 billion. The asset has gained 4.70% during the last 24-hour period.
The recent pullback brought the price beneath the 50% Fibonacci retracement level calculated from the $81.71 to $90.29 swing. An ascending trend line has emerged on the hourly chart, providing support near $85, which corresponds with the 61.8% Fibonacci level.
Market analyst BitGuru observed on March 2 that SOL appears to have completed its corrective phase and transitioned into consolidation. He highlighted the formation of higher lows near an established support zone as indication of diminishing selling momentum.
Traders are monitoring $88.60 as the initial crucial level for reclamation. Market commentator More Crypto Online stated that a push above Sunday’s high at $88.60 would demonstrate renewed buyer strength.
Key Resistance Levels to Watch
Resistance zones are located at $88, followed by $90, and $92. Breaking above $92 may clear the pathway toward $96 and subsequently $100.
Should SOL encounter difficulty surpassing $90, downside targets include $84, followed by $82. A daily close beneath $82 may direct the price toward $76.50.
The RSI stands at 47.68 — positioned in neutral territory. The MACD reads 1.80, showing mild positive momentum, though remaining below the signal line at -4.29. Bearish pressure has diminished, while bullish forces have yet to establish dominance.
Solana currently trades below its major long-term moving averages. The 50-day SMA sits at $103.66, the 100-day at $117.73, and the 200-day at $156.34.
Ichimoku Cloud Break Signals Shift
On the 4-hour timeframe, SOL penetrated back above the Ichimoku cloud, achieving this milestone for the first time since January. During February, each rally attempt encountered resistance at this cloud formation.
The 50-period moving average has also crossed above the 100-period moving average on the 4-hour chart. Analyst CryptoCurb characterized this development as a structural shift in trend dynamics.
Both moving averages have started exhibiting upward trajectories. A chart analysis shared by CryptoCurb suggests a possible advance to $100 and higher levels, dependent on the price maintaining position above recently reclaimed zones.
Currently, SOL trades at $87.64 with preliminary recovery indicators visible, though a confirmed trend reversal remains pending.