
Key Highlights
- ETH declined approximately 50% from $4,700 (Oct 2025) down to ~$2,300 while buyers continue accumulating positions
- The taker buy/sell ratio reached levels last seen in January 2023, indicating strong buying pressure
- Smart contract deployments recorded their highest 180-day moving average in history
- Ethereum spot ETFs attracted $155M in net inflows during the most recent week — marking three straight weeks of positive flows
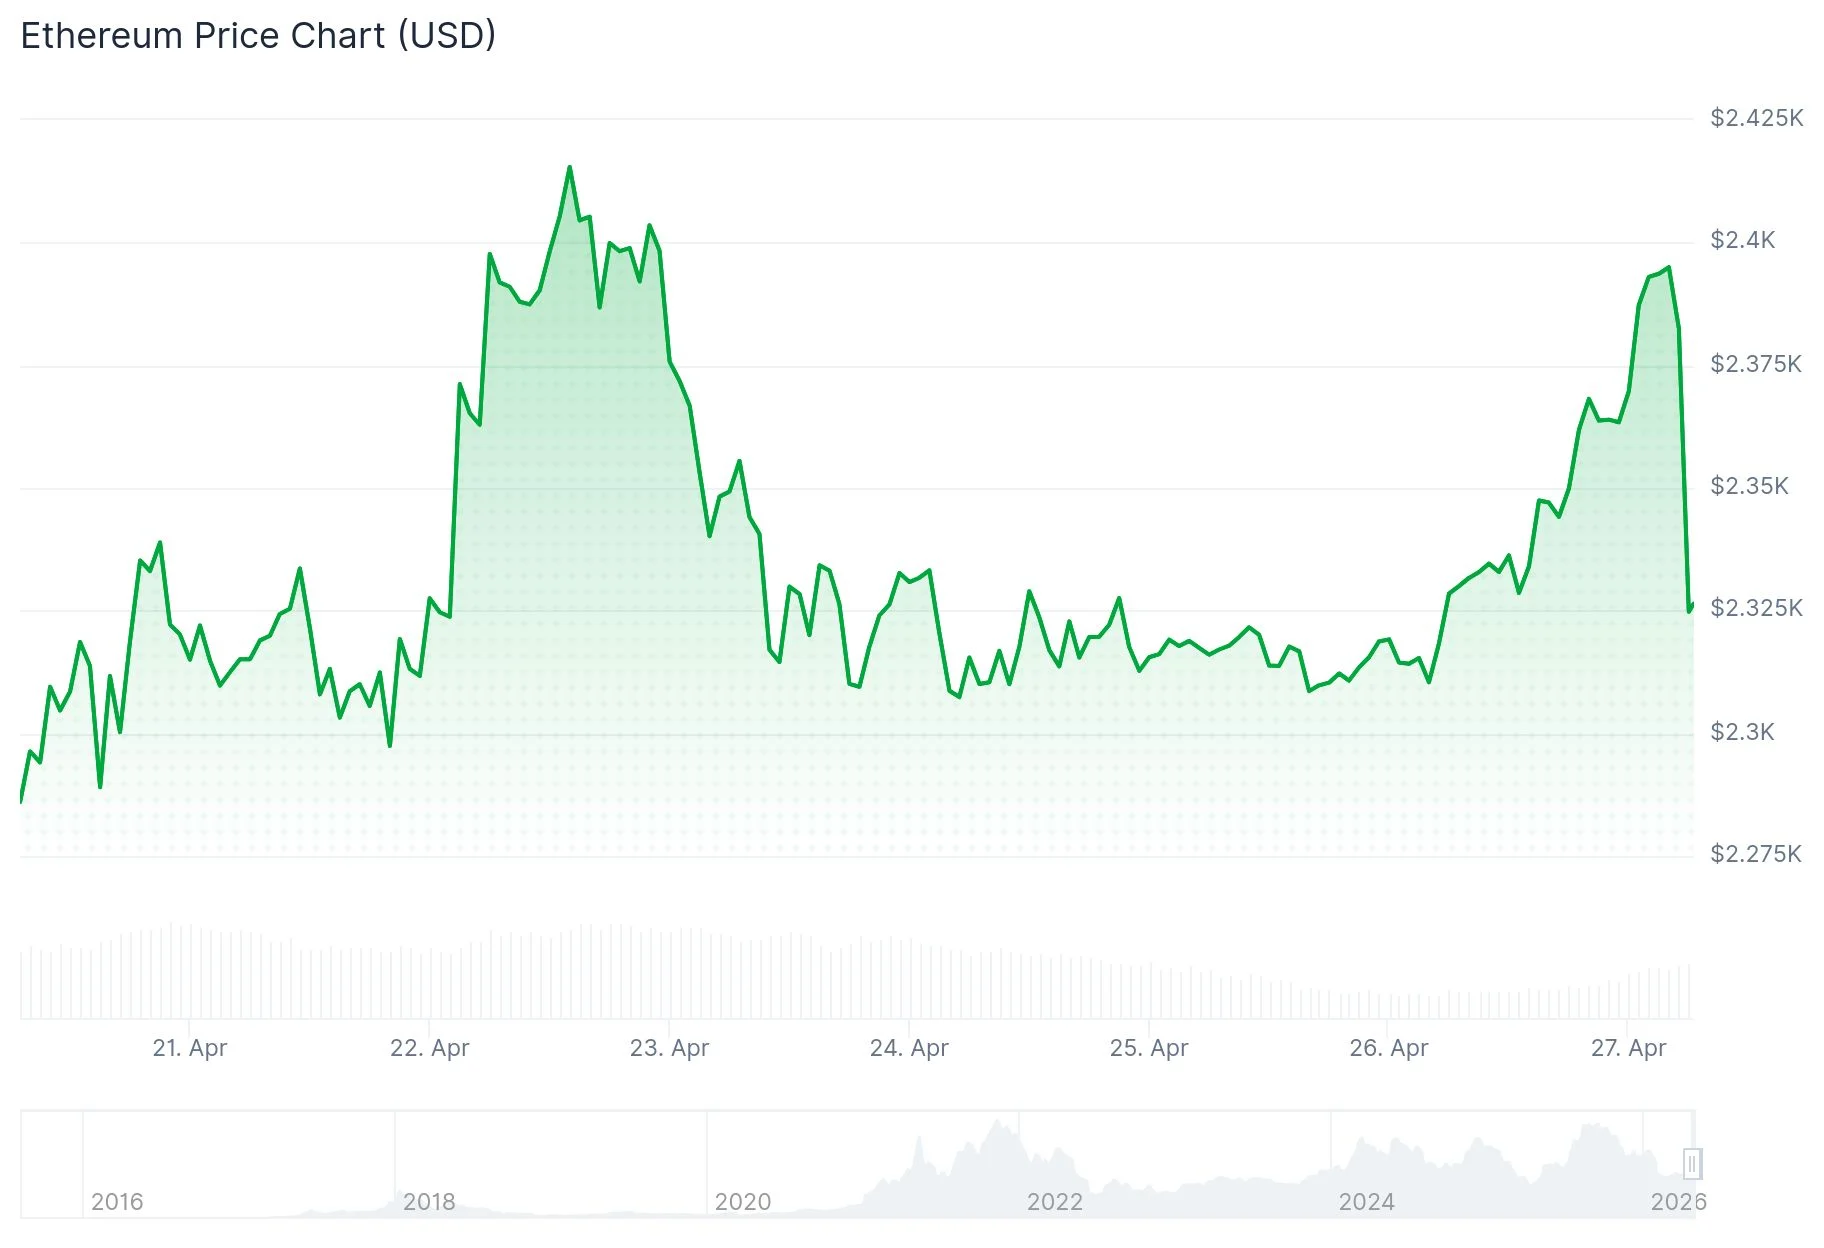
- Critical price zones: $2,400 overhead resistance, $2,200 downside support
Ethereum has experienced approximately a 50% drawdown from its October 2025 peak around $4,700, currently hovering near $2,300. While the extended decline continues, blockchain metrics indicate accumulation patterns are forming.
According to CryptoQuant analytics, the taker buy/sell ratio’s 30-day moving average has climbed to levels last observed in January 2023. This indicator measures the intensity of aggressive buying relative to sell orders across exchanges.
Market participants continue absorbing available tokens during the downtrend. This pattern typically reflects institutional investors and sophisticated traders establishing positions during market weakness.
Network Activity Strengthens While Price Consolidates
Additional CryptoQuant metrics reveal the 180-day moving average for newly deployed smart contracts has achieved an all-time high. Builder engagement continues expanding despite subdued token valuations.
Historical patterns show that increases in smart contract deployment often come before price reversals. The gap between expanding network usage and current price levels indicates fundamentals may be undervalued.
Ethereum spot ETFs attracted $155 million in net inflows during the April 20–24 period, based on SoSoValue figures reported by Odaily. This represents the third consecutive week of positive net flows.
BlackRock’s ETHA dominated weekly inflows with $138 million, pushing its cumulative net inflow to $11.97 billion. BlackRock’s ETHB contributed another $60.9 million. Grayscale’s ETHE experienced the largest withdrawal at $49.2 million. Combined net assets across all Ethereum spot ETFs currently total $13.79 billion.
Analyst Ted (@TedPillows) observed that ETH continues trading in a sideways range and highlighted that the breakdown of US-Iran peace negotiations could introduce volatility in the coming week. He suggested that breaking above $2,400 could expose the $2,470–$2,500 liquidity area, whereas falling below $2,300 might lead to retesting the $2,150–$2,200 zone.
Technical Levels and Market Structure
Looking at the hourly timeframe, Ethereum cleared a tightening triangle pattern with resistance around $2,320. Price advanced to $2,404 before entering a consolidation phase. ETH currently maintains position above $2,370 and the 100-hour simple moving average.
The nearest resistance zone begins at $2,400, followed by $2,420 and $2,450. Clearing the $2,450 level could open pathways toward $2,500 and the $2,550–$2,565 range.
For support levels, $2,330 represents the initial line of defense. Further down, $2,285 and $2,200 serve as significant floors worth monitoring.
Bitmine Immersion Technologies, connected with Tom Lee, disclosed plans to purchase 10,000 ETH directly from the Ethereum Foundation through an over-the-counter transaction valued at $23.9 million, which would increase its total position to 4.98 million ETH.